
From Earth is a Nuclear Planet by Mike Conley (Author), Tim Maloney Ph. D. (Author), Stephen A. Boyd Ph. D. (Scientific Editor)
Author: THE KERNEL
Listen to the audiobook version here!
Some environmentalists have such a pronounced distaste for nuclear energy that they categorically dismiss the subject without further discussion. This is unhelpful to say the least, especially given nuclear’s excellent record of performance and safety.
The accidents at Fukushima and Three Mile Island killed no one, and no one will ever build a reactor like Chernobyl again. And yet, some people seem almost stubbornly afraid of nuclear power. It’s like writing off every automobile that’s ever been built, or ever will be, because some Pinto gas tanks blew up a half-century ago. Chernobyl was the Pinto of nuclear reactors.
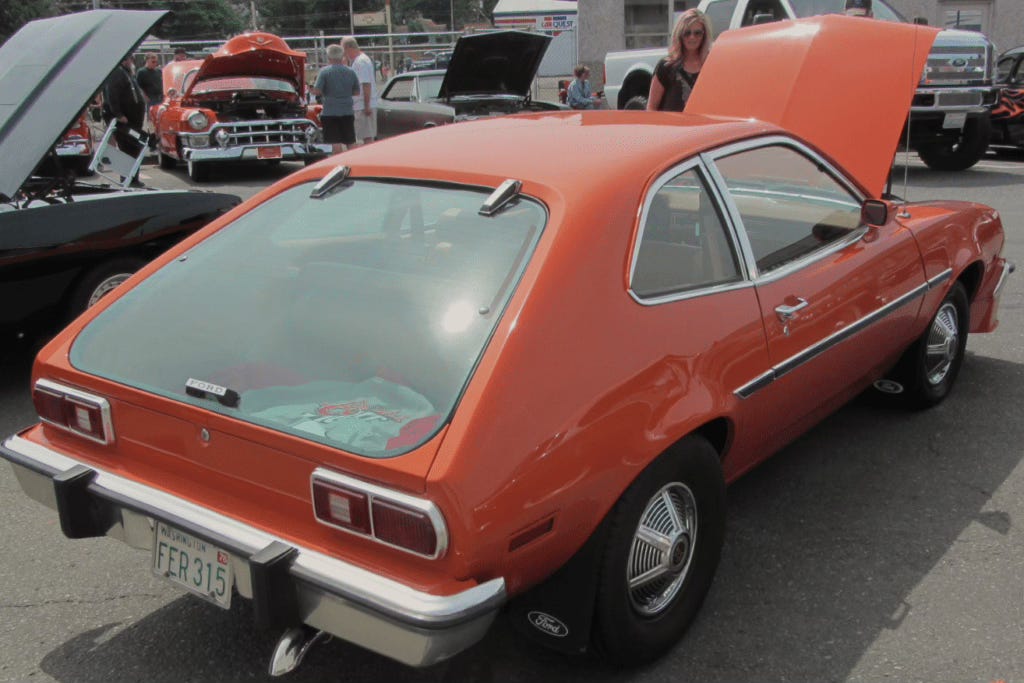
(Pg. 49) 1970 Ford Pinto, With Faulty Gas Tank
Credit: John Lloyd (CC-BY-SA-2.0)
As renowned green journalist George Monbiot wrote in The Guardian newspaper, just days after Fukushima:
“While nuclear causes calamities when it goes wrong, coal causes calamities when it goes right, and coal goes right a lot more often than nuclear goes wrong.” [1]
This perspective doesn’t seem to matter to some people, but it should. Because the actual harm caused by the production of nuclear power is nearly nonexistent.
After sixty-five years, with about 100 reactors operating in the US and another 100 or so at sea, only sixteen deaths have been attributed to the production of American nuclear power: Three operators perished from the partial meltdown of an experimental reactor at Idaho National Laboratory in 1961. [2] Ten additional deaths came from construction accidents at various commercial power plants, and there have been three deaths and one severe injury in the US fuel-enrichment and processing industry. [3] After generating about 27 trillion kilowatt-hours of clean electric energy over the last several decades [4] (equal to 29 years of electricity for all US single-family homes), not a single member of the American public has been injured or killed by the production of nuclear power, or by “spent” nuclear fuel (SNF).
By health and safety statistics, an operating nuclear power plant is one of the safest work environments in the country. [5] And as it turns out, the elevated leukemia rates found near some nuclear plants, formerly blamed on radiation, have now been linked to other indus- tries, both past and present, in the same industrial zone. [6]
The fact is, nuclear power is so safe that a person in the United States actually has a greater statistical chance of being shot by their own dog than being harmed by either nuclear power or nuclear “waste.” [7] Amazing, but true: About one American each year gets shot by their own dog. Allowing for population growth and recent gun proliferation, we can guesstimate that there have been roughly thirty-five dog-involved shootings in the US since the advent of commercial nuclear power in 1957. Compare this to the casualties cited above.
But even if we do accept nuclear’s stellar safety record, what about the mining?
4.1 DIGGING DEEP
There was a substantial number of cancers and mortalities in the early days of US uranium mining and milling, most of which took place in the Navajo Nation with local labor. [8] At the time, cigarette smoking was common, and safety regulations were either lax or non-existent. As it turned out, inhalation of mining dust and high levels of radon gas (which decays into the same radioactive polonium found in cigarette smoke) were contributing factors at any type of underground metal mine, and not just uranium digs.
The arms race against the Soviets and the systemic neglect of Indigenous American health and safety made the situation even worse. Wind-blown dust from abandoned mine tailings and waste rock may well have caused cancers and shortened lives, and leaching chemicals from insitu mining were not always properly monitored, which polluted local aquifers (note the monitor wells in Fig. 23). As regulations and oversight improved, ventilation and respirators were introduced to deep-shaft uranium mining. Casualty rates soon reduced to the same levels found in other metal mining operations. [9]
Canada mines far more uranium than the US, and a major study has shown that the health of their miners is on par with their American counterparts. And just how healthy are their miners? “There has been no known case of illness caused by radiation among uranium miners in Australia or Canada.” [10]
Another Canadian study shows that the CO2 released by uranium mining and milling amounts to just 1.1 grams per kilowatt-hour of electricity produced from the resulting fuel. [11] When power plant construction, O&M (operations and maintenance), and decommissioning are factored in, nuclear power’s total lifecycle carbon emissions are only 6 g /kWh. [12] Compare this to the whopping 380 grams per kWh emitted by heavy coal-burning countries like Germany. [13]
And this was before Russia invaded Ukraine. Eight months later, in November 2022, anti-nuclear Germany was up to 459 grams of CO2-equivalent emissions and facing the onset of winter. As shown in Fig. 22 below, nuclear has the lowest greenhouse gas (GHG) emissions of any clean-energy technology.
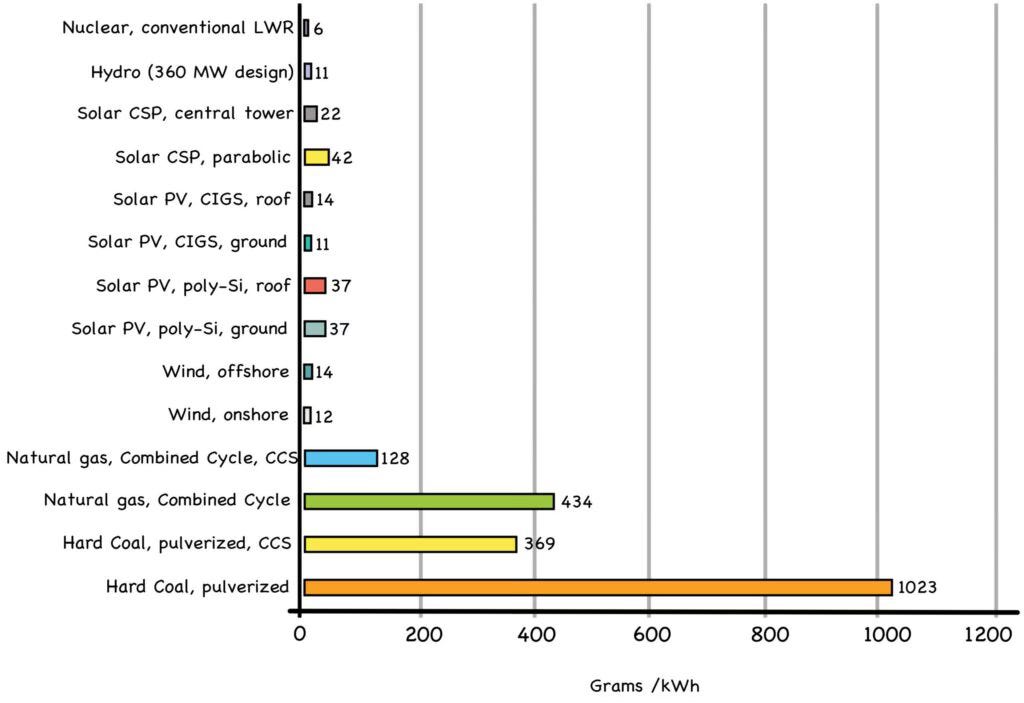
Fig. 22: Lifetime CO2-equivalent Emissions
Source: https://unece.org/sed/documents/2021/10/reports/life-cycle-assessment-electricity-generation-options
Nuclear’s meager emissions can be further reduced to nearly zero with electrically powered equipment for mining, milling, processing, and construction, energized by a nuclear grid or an on-site microreactor.
Even so, the total environmental impact of an energy system comes from more than its carbon emissions. The resources consumed in building, fueling, operating, maintaining, and decommissioning the system must also be taken into account, along with the mining to procure said resources. The essential question is this: What is the total footprint of a given energy system, compared to the total energy derived from that system?

(Pg. 53) Caterpillar Model 793, Now Available with Electric Drive
Credit: Rob Simmons (CC-BY-SA-4.0)
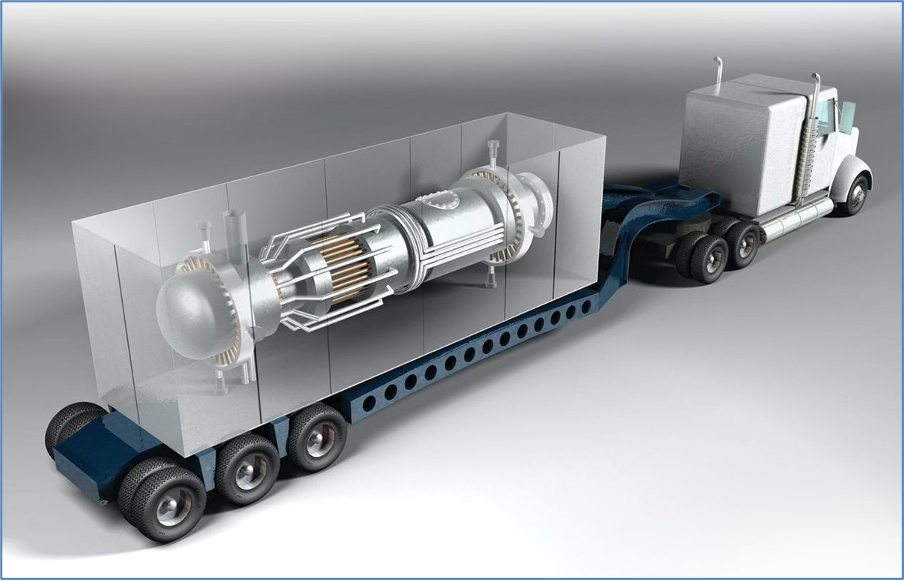
(Pg.53) Mobile Micro Reactor for Off-Grid Power
Source: inl.gov/
“Throughput” is engineering speak for the resource consumption of a system. Conventional power plants consume fuel as they operate, but they also “consume” a variety of other material for extended periods of time. Construction components like steel and concrete are typically amortized over the productive life of the plant.
The steel throughput of a power plant, for example, is the quantity of steel used relative to the energy produced by the plant. If 70 tonnes of steel are used to build a nuclear plant with a yearly output of 1 TWh (one terawatt-hour) and an estimated lifespan of 60 years, the plant has a steel throughput of about 1.17 tonnes per TWh (70 ÷ 60 = 1.166).
But caution is strongly advised—relying on this popular metric can sometimes be awfully misleading, because any throughput calculation is only a snapshot. As technologies evolve, they often reduce their material throughput, sometimes dramatically. For example, engineers now have the technology to make a reactor last for eighty years or more, doubling the original forty-year estimated lifespan. [14]
This doubling cuts the steel throughput of a nuclear plant in half, which dramatically alters any quantitative analysis. And since doubling the life of a reactor effectively doubles the life of the entire plant, the throughput calculations for concrete, copper, glass, aluminum, and other materials used in building the plant will reduce as well.
NERD NOTE: The metal walls of a Reactor Pressure Vessel (RPV) become embrittled over the years, as the zooming neutrons in the core bury themselves in the metal walls of the RPV. Through physics wizardry, some metals will slowly transform into wall-weakening elements such as helium-4, iron-56, and other pesky isotopes.
Over the years, these insults eventually degrade the metal’s crystalline structure, making the vessel susceptible to microscopic cracks. Since this is a well-known issue, operators conduct embrittlement inspections during each refueling cycle. Luckily, a reactor vessel’s metal crystalline structure can be restored by “annealing” the metal. [15] The emptied vessel is heated at 550o C for about 200 hours, then slowly allowed to cool. This repairs the crystalline structure of the metal, even after years of neutron bombardment. Large RPVs can be annealed in place with induction heaters—the Russians are already doing this. [16] The RPVs of small modular reactors will be taken back to the factory for annealing, refueling, and other maintenance. Since high-temperature Generation-IV systems like the molten-salt reactor (MSR) will operate well above 550o C, the tantalizing possibility exists that MSRs will be continuously self-
annealing, enabling service lives of well more than a century. (They should have fusion figured out by then. ☺)
Energy generation requires mining for two different things: the material for building the plant, and the material to make the fuel. In contrast, passive energy-harvesting technologies like wind and solar do not require fuel. (Wind and sunshine are not fuels; see Chapter 7). Nuclear power takes the extra step of excavating deep geologicrepositories (DGRs) for the long-term storage of used reactor fuel (see Chapter 18). This mining must be considered as well. [17]
Currently, nuclear must dig for its fuel, while renewables obvi- ously do not. Their “fuel” comes to them free of charge and with no mining karma attached, which is nice work if you can get it. About 90% of the uranium for US reactors is mined and processed outside the country, where ore concentrations are typically higher. [18]
Nowadays, most uranium miners don’t even go underground. This partly stems from advances in automation, and partly because 57% of the world’s uranium, and virtually all uranium mined in the US, is now being extracted by in-situ leaching (ISL). [19] This simple process injects a leaching solution into an underground uranium deposit, either a sodium carbonate mixture (basically, washing soda) or a dilute, vinegar-strength sulfuric acid, depending on the chem- istry of the ore body. Pumps draw up the dissolved uranium, which is then piped to an on-site mill where the slurry is dried and filtered.
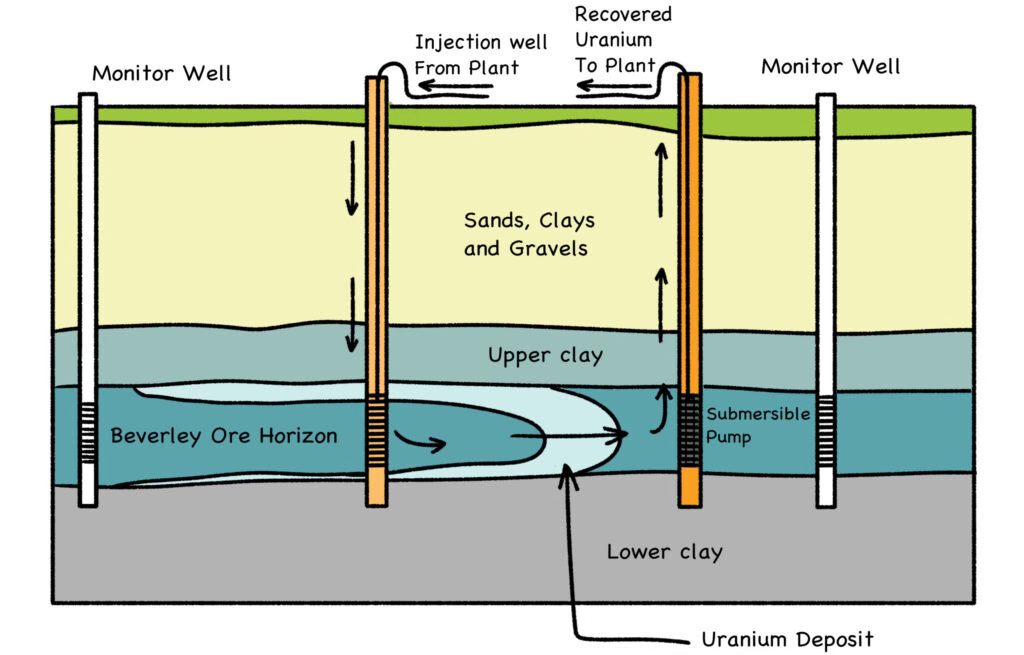
Fig. 23: In-Situ Leaching
Source: https://world-nuclear.org/information-library/nuclear-fuel-cycle/mining-of-uranium/in-situ-leach-mining-of-uranium.aspx
One nice thing about in-situ leaching is that it doesn’t generate waste rock and leaves almost no “tailings,” the final waste material of any dirt-mining process. Some copper mines also use ISL, but most copper is extracted through either deep-shaft or open-pit mining, and renewables use a lot of copper (see Fig. 24 below).
But whether a mineral-bearing ore is scraped from the surface, or brought up to the surface, or left where it is (in-situ) and leached of its desired mineral, the same chemicals are used to leach uranium and copper from their respective ore. Whether it’s a uranium mine or a copper mine, the mineral-bearing ore is ground into rubble and milled into a sand or powder, then the material is piled in heaps and sprinkled with an alkaline or acid wash, depending on the ore chem- istry. The “pregnant liquor” is collected from below, and processed to remove the leached-out metal. Finally, the depleted liquor is sent to a tailings pond, where it dries to a solid.
4.2 DIRT MINING
The 43% of mined global uranium that is not recovered by in-situ leaching is mined by either underground or open-pit methods. We estimate that the combined global average waste-to-ore ratio for uranium dirt mining is about 3.9:1. This means that for every tonne of uranium-bearing ore dug from the earth, about 3.9 tonnes of waste rock will be displaced as well. (See Part One of our mining supplement: [20])
In open-pit mines, this is called the “strip ratio.” The only real difference between open-pit and underground mining is whether the ore body is close to the surface or deep underground. But once the ore is accessed, the process is the same: The ore-bearing raw material is excavated, waste rock and all, and sent to the mill for processing.
Once the mill extracts the mineral from the ore, the depleted ore is considered waste rock as well. Although, when prices rise, depleted ore tailings are a top candidate for re-leaching. Since the leaching process is imperfect, there will always be a bit more uranium that can still be extracted from the rubble and dust of an evaporated waste pond—for the right market price.
Ore concentrations will vary from mine to mine. Some of the world’s best uranium deposits have ore concentrations of 0.5% or higher, but most mines have significantly lower values. We show in our mining supplement that the world’s average uranium ore concentra- tion (often called the “ore grade”) at today’s mines is a paltry 0.078%.
You don’t need to be a uranium prospector to know this means some mighty slim pickings: For every kilogram of uranium-bearing ore dug out of the earth, chances are that only about 0.078% of each kilo (78 grams) will be uranium oxide.
A comprehensive assessment of any system’s environmental foot- print would have to consider the total material dug out of the earth in order to build, operate, and maintain the system. This includes the waste rock, the mineral-bearing ore within the waste rock, and the finished material (refined mineral) derived from the ore (steel, copper, etc.). The recycling of finished material must also be taken into account, as this can significantly reduce the mining and milling footprint.
Only 43% of global uranium is obtained from dirt mining, while 57% comes from in-situ leaching. While the finished material throughput for nuclear is tiny compared to other energy technologies, nuclear’s raw material throughput can be substantial, due to the volume of waste rock dug up by 43% of global uranium production.
Aside from digging into the numbers on uranium, we also con- sidered the raw material (displaced earth) behind the other finished materials needed to build and maintain nuclear, wind, and solar energy systems. (See Part Two of our supplement: [21]) For some perspective on this: The global rock-to-metal ratio (RMR) of elemental iron, fromwhich steel is made, is 9:1. That is, for every tonne of iron-bearing ore, nine tonnes of waste rock are typically exhumed as well.
More fun mining facts:
• Rock-to-cement is about 1.6:1
• Rock-to-cement-to-concrete is about 1.1:1 • Rock-to-aluminum is about 7:1
• Rock-to-chromium is about 18:1
• Rock-to-zinc is about 71:1
• Rock-to-copper is about 513:1
• Rock-to-uranium is about 3,000:1
• Rock-to-fuel pellets is about 21,700:1
These last two numbers clearly suck, especially for a massive and long-term buildout of nuclear power fueled by freshly-mined uranium. But as karma would have it, there are several alternative sources for reactor fuel which can greatly reduce—and potentially eliminate—any future need to displace more raw material to make even more fresh fuel pellets. We’ll explore these game-changing options in the next two chapters.
To be entirely candid, it will be difficult for existing nuclear tech- nology to build out big enough and fast enough, and do the job it can plainly do, so long as it continues to rely upon business-as-usual uranium mining for its fuel supply. The first automobiles were built by hand, but things had to change to put the world behind the wheel. Sources and methods must change as well for the buildout of nuclear power.
For an in-depth discussion of where uranium mining sits at pres- ent, we invite you to dig through our mining supplement (bring a calculator). But as you explore the numbers, keep in mind that they are only a snapshot of existing conditions. Methods can and will change bigly in the years to come.
The legacy of uranium dirt mining leaves little to be proud of, but things have changed. Stringent regulations now ensure that existing and future uranium digs must set aside sufficient funds for land reha- bilitation. The former Mary Kathleen Mine in Australia, for example, is now an operating cattle station with unrestricted access. [22]
In Kazakhstan, where the world gets nearly 40% of its uranium (Fig. 24), virtually all U mining is now done by in-situ leaching. The same holds true for every U mine in the United States, most of those in Uzbekistan, and some in Russia as well. Most of the uranium dirt mining that is still being done in this world is taking place in Canada and Australia, where mine rehabilitation is strictly enforced. Much of the rest is happening in Namibia and Niger, where China has been scooping up underperforming mines.
Digging for fuel doesn’t have to leave a scarred landscape. Unlike coal mining, in which half or more of the exhumed material is carted away and burned, uranium mines have plenty of waste rock to fill whatever hole they dig. That’s because the recovered uranium will often average just 0.078% of the total displaced earth—less than one-tenth of one percent.
At a properly managed uranium mine, displaced earth becomes replaced earth. Once the mine is played out, the hole is filled and the land is rehabilitated for future use. This approach even passes muster in anti-nuclear Australia, where they’re grazing cattle atop a rehabilitated uranium mine. Ironically, nuclear fear helps to ensure this happy
outcome. Unlike iron and copper mines, where rehabilitation may not be strictly enforced, the onus on uranium has inspired both locals and environmentalists around the world to pay very close attention to the rehabilitation of any uranium dig—even though the rubble at a granite quarry can be as radioactive as uranium mine tailings. [23]
The good news is that the mining footprint of nuclear fuel can be reduced to virtually zero with existing and emerging technology. This will come in handy, because as we show in Roadmap to Nowhere, the US may need about 1,800 GW of nuclear power to supply all “primary energy” by 2050, meaning all forms of energy, not justelectricity. The country now has about 95 GW up and running, so a national nuclear grid would amount to a twenty-fold increase. That means twenty times the fuel, but it does not necessarily mean twenty times the mining.
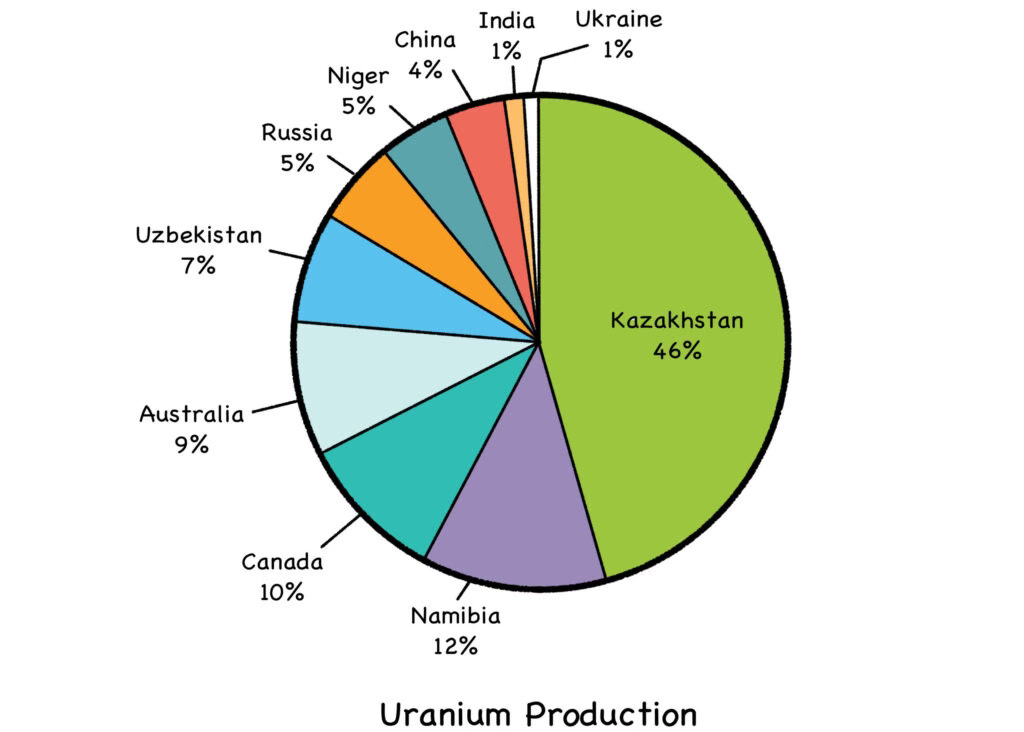
Fig. 24: Uranium Producing Countries (2019)
Source: https://worldpopulationreview.com/country-rankings/uranium-production-by-country
With the alternative sources and methods discussed in the next few chapters, both a national and global buildout of nuclear power would be entirely feasible—and sustainable—with an environmental footprint a mere fraction of what renewables could ever hope to achieve, even with dirt-cheap grid-scale batteries. By midcentury, the throughput for nuclear power could look something like this (see our mining supplement for calculations):
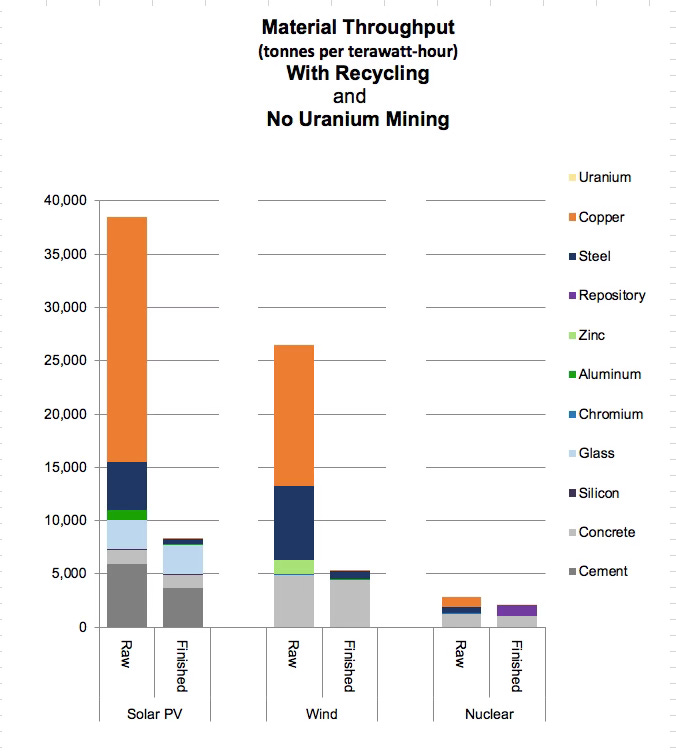
Fig. 25: Raw and Finished Material Throughput (Tonnes/TWh) with Recycling (and no uranium mining)
Credit: By the authors
Learn More About Earth is a Nuclear Planet Here
Pre-Order the Book Today!